


For me, finding right stocks to trade is the basis allowing me to start considering potential gains from transactions. That is why I am so interested in finding the so-called hot stocks, in the case of which the potential for preparing a setup for my trading strategies is decent.
In order to find such companies, I take advantage of a variety of trading-related tools. Some of them are utilized for weekly analysis of the so-called Market Movers, for which I assume particular trend continuation or reversal patterns. The second group analyzed includes companies I have not gathered any information about. Those are the companies that may be beneficial in the future. How do I know that, though? :))
Hot stocks – how to look for them?
To find companies that will attract an extreme number of traders interested in them in the foreseeable future, you have to spend some time preparing. As you may know, the majority of novice traders become interested in companies that have been generating buzz for quite some time – when there have been a significant drop or increase and when the best starting position have been irreversibly lost. They tend to choose a bad time to start trading their stocks.
Why is that so? In my opinion, such a state of affairs is caused by the sheer lack of knowledge and the inability to get hold of certain tools. Interestingly enough, it may sometimes be caused by the failure to properly use the already owned tools.
Finding Hot Stocks – example
Let us take the company discussed below as an example. Please, familiarize yourself with its 1-minute, 5-minute, and daily charts. How have I come by this company? It is the effect of regular analysis of company charts, as well as the utilization of proper tools that help me find a company in the case of which something unique may happen.
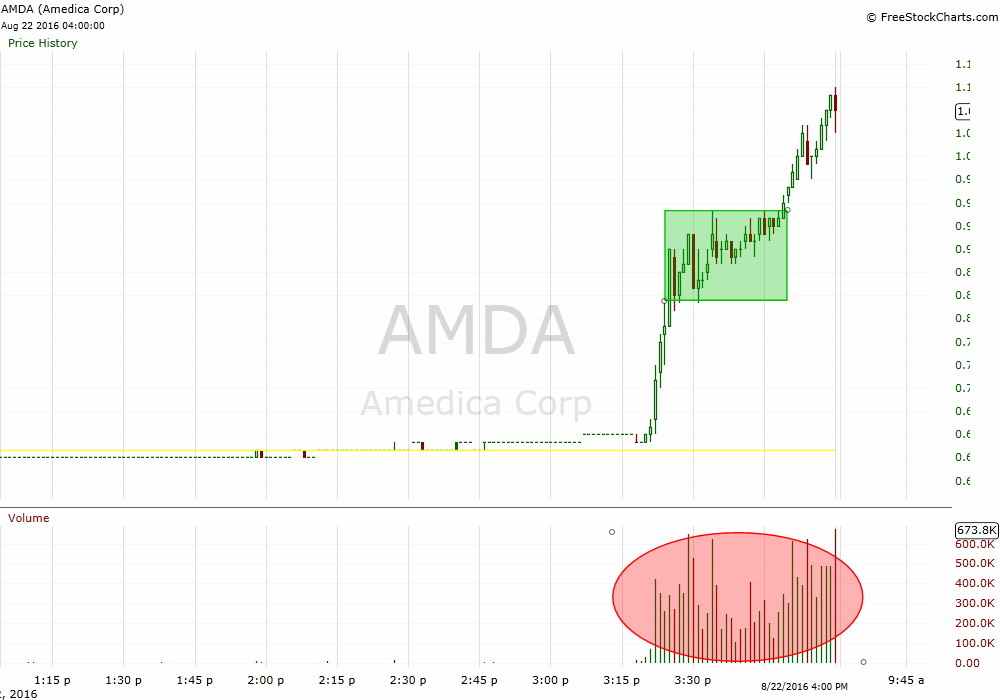
1-minute chart
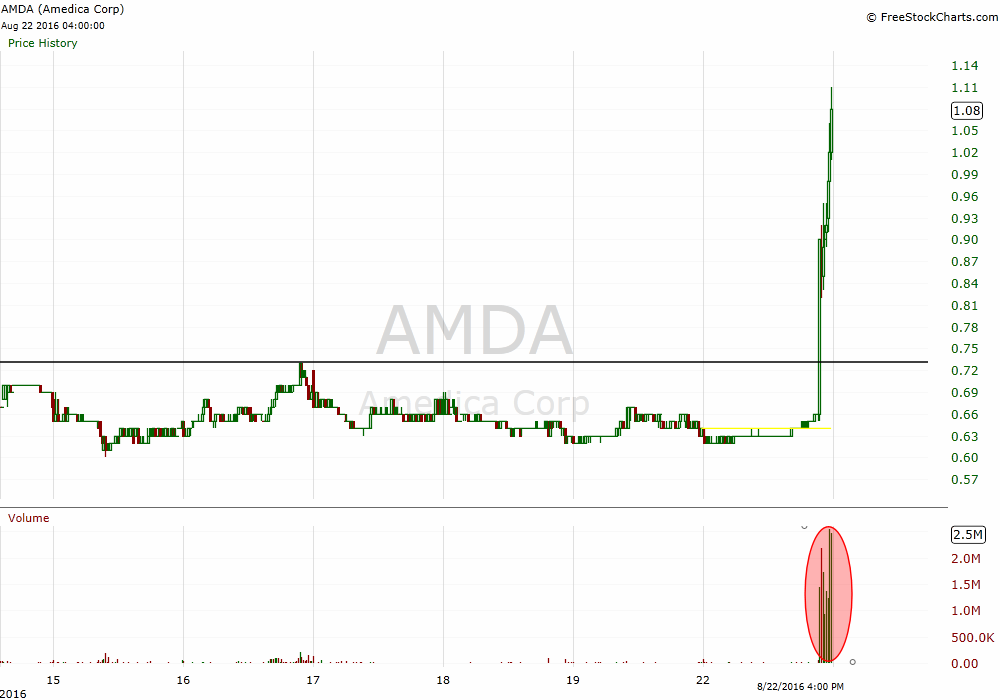
5-minute chart
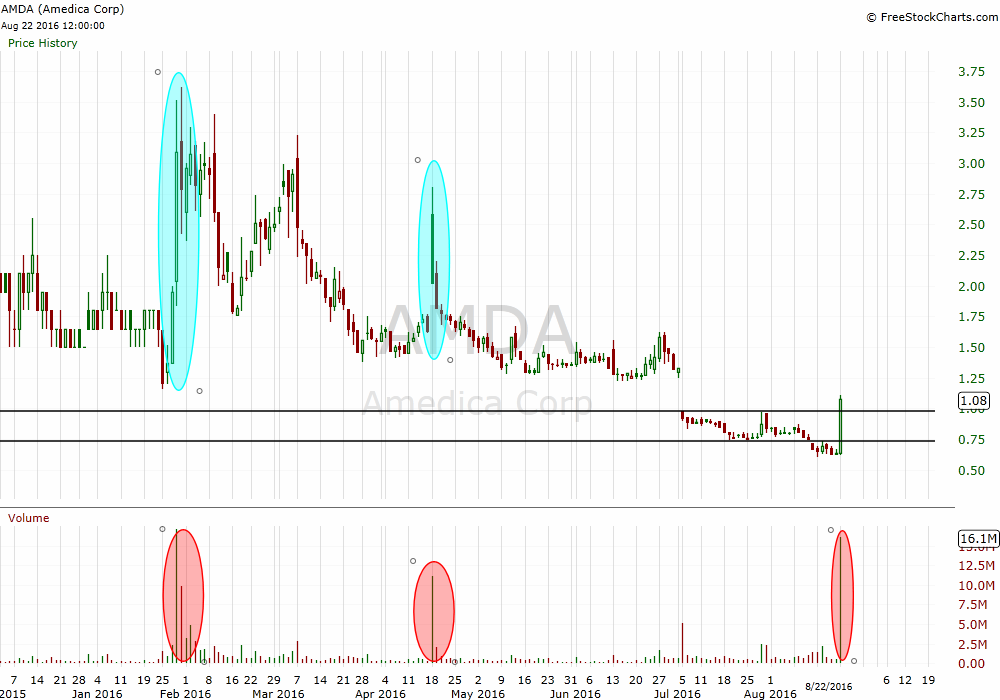
Daily chart
There were significant breakthroughs in the case of this company. There were significant movements on the increased volume. During the said movements, two patterns emerged that could have been used for trading. Nevertheless, some traders noticed the company too late and tried to generate profit from it by opening new positions at confusing prices (they though that they should have gone for a long, as there might be an increase). Why?
-
Their access to data was delayed
-
They did not check the overview of strong companies implemented in the platform
-
They could have not been using their computers at the exact moment.
-
They would like to be day traders, but they did not have enough time to prepare for a session properly.
Because…, because…, because… there were numerous factors to account for, surely. Instead of focusing on them, you should start acting. Create an opportunity to earn and do not look for justifications of your failures or delays.
How to do that?
Firstly – if you happen to notice an interesting company, check what has happened to it earlier. Check what factors have changed.
What do I have in mind exactly?
Check the daily chart of a company and juxtapose it with the ones from previous days. In the example, you can see that the volume was gradually increasing. Sometimes, the said fact is combined with the occurrence of candlestick real bodies. In such a case, you have at least two aspects that can be taken advantage of while filtering companies.
- Volume change.
- Average true range.
They may seem as just two simple variables, but they may change a lot. Thanks to being in possession of key pieces of information, you can filter approximately 8000 companies and find several of them showing exceptional potential. Thanks to that, you will be able to focus on a smaller number of companies, at the same time increasing the quality and efficiency of your actions.
The variables have been indicated in the chars presented above. Please consider the changes that are in red. Check the variability (marked blue on the daily chart) and movement patterns (green).
Let us go back to the daily interval. Check the history of a company you are interested in. In the example, I have marked them in blue. You should notice that in the past, there were notable price changes during single sessions, especially after breaking local thresholds. Such a threshold was the price of 0.98$. It was a strong signal. Thanks to filters used, you can notice the changes even on the 5-minute chart – at the level of 0.72$.
Even if you had been trading and had missed the exact opportunity, an interesting pattern would have started emerging at 0.88-0.94$. It has been indicated in the 1-minute chart.
You should notice that the interest in the company increased after it had reached a specific price margin. How could you have known the margin in question? The answer is quite simple – you could have made an overview of companies and add proper alerts. I had had mine at the level of 0.98$ for quite some time. Thanks to the action screeners used, I started focusing on the company at the level of 0.80$. As you can see, I missed the starting position of 0.72$, but I waited for the pattern to become apparent at the level of 0.88-0.94$.
Chart overviews help finding hot stocks
Consider the following: when does company’s price notably deviate from the norm? Do you know the answer?
-
It has published its financial results.
-
Certain news has emerged.
-
Company is set up for information that are going to be published in the future.
You are not able to foresee or assess news, especially if you are not interested in the condition of a company, its foundations, or pieces of information about auction it has been participating it. Then, you are a trader rather than an investor.
However, you do know when quarterly reports are published. Do you not know that?
In such a case, use
– daily stockwatch list
– Data published by Finance Yahoo
– finviz.com browser
– earningswhispers.com website
Typically, the report publication period is marked with notable price changes having their peak at the date of report publication. You should be ready then. I publish such a list daily after the assessment of all the possible outcomes.
If you know that a company is going to publish results, analyze its chart and check which price levels are crucial and may interest a bigger number of traders, at the same time ensuring the variability and increase of the volume.
Check the selected company’s variability in the period of quarterly result publication. It is clearly visible, is it not?
Look at the chart below. Where would you mark the key levels? I have done it the way you see it below. 0.98$ is the key, right? After breaking through the said level, company’s price changed as follows: 1.22$ -> 1.62$. While perceived in percent, it was a really noticeable change.

I was writing this article piece by piece for several days. Look what happened to AMDA in the said period. The 1.60-70$ level has been marked as yet another crucial threshold that was reached. Below, you can see a chart from freestockcharts.com, the website the charts of which I like publishing the most (the list of free chart websites can be found here – Free stock charts). The platform accounts for both pre- and post-session trading. The following changes could be observed:

Again, this example was not interesting for me, as I did not see thresholds which, after being exceeded, may result in the increased interest in the company by traders.

How to increase the likelihood of finding hot stocks?
I would start from answering the following question:
1. When do you start your stock session?
I start mine at 1:00 P.M., even though the session starts at 3:30 P.M. Why do I jump in so early? Because I know that the so-called Market Movers may appear earlier in the pre-session period. Therefore, I can trade even before the session proper is being launched. On the other, I have the possibility of preparing for the session and making a trading plan in advance.
In order to prepare for the session and take a satisfactory advantage of the pre-session period to find proper companies, I would highly recommend using the following websites:
– mine 🙂 for all the lazy people – visit bedaytrader.com and click the stockwatch list on right sidebar
– finviz.com
– earningswhisper.com
– nasdaq.com
– Twitter
For me, it is an absolute minimum to prepare myself to trading on companies that I have found interesting during the pre- or post-market session and that have shown the likelihood of desired changes. I also expand my preparations by adding the overview of lastly traded companies, as well as those changing unnaturally to it.
During the pre-session period, I also use the Trade Ideas stock screener. Thanks to the said fact, I am familiar with companies, for which variability and volume has changed. I use two screeners. Below, I provide you with Cloud link to pre-market screener, and social media screener.
Are you lazy and tend to check your computer few minutes before the session start in hope that it will all go all right? It may be so, but you are then not very likely to achieve a significant success.
What others consider to be hot stocks?
Currently, social media is the way to go, even when we are talking about trading. Check what other traders consider as their options. In contrast to typical investors, you should be not interested in the ups and downs of the company. You are only interested in variability and volume changes that are unusual, as they may generate some profit for you. That is why you should take advantage of social media.
To do so, you should use the following three techniques I take advantage of every single day:
-
Check out my channel on Twitter as well as the ones of traders I follow. It is the best option not to miss any stocks in play.
-
Stocktwits – if they write about something, it means that something big may happen. However, be careful and do not treat any info about numerous traders being interested in a given company as an invitation and do not try to find a good starting price senselessly. Remember that you should use your setups and know why exactly you have opened a particular position.
-
Follow the accounts of other traders. I mainly check those who post other messages than those oriented towards selling their products, as well as those including successful actions that are published with the benefit of hindsight.
Check who I follow on my Twitter.
My limitations while choosing hot stocks
Not every company for which variability and volume increase can be considered „hot stock”.
I am very rarely interested in companies the value of which exceeds 50$ and that have a remarkable spread. Remember to choose your options by considering what you personally prefer to trade with. Some of you may like focusing on more valuable companies. I am not interested in them and I am not willing to waste my time on them. Besides, the higher the value and the bigger the spread, the more complex risk management and positioning schemes. Thanks to my choices, I rarely engage in excessive transactions and I do not deal with those which are far from my trading expectations and goals.
Your very own hot stocks list
In my opinion, it should be your final step. Follow others and analyze the situation on the market. With time (preferably – as soon as possible) you will learn how to create your own list of hot stocks, companies that may be of interest for you throughout the day.
Thanks to such a solution, you will focus on the most promising companies, and your list will be tailor-made 🙂
I personally observe numerous traders and their daily stockwatches. It does not mean that I copy their companies to my list. In some cases, 90 % of them are not alluring for me, as they do not meet my criteria. Companies that are profitable for some may not be such for you.
Another important issue – hot stocks during the quarterly report publication section
During the consecutive years of trading, I have checked a number of companies. I use some of them for trading regularly. It means that every quarter, I trade the stocks of certain companies on regular basis. I just like their variability when they become hot stocks of the day. I am able to notice the recurring setups in their change patterns. It must be said that such repetitive stock patterns are the best ones to take advantage of.
I simply have my favorite companies. Every quarter, I predominantly focus on them during the quarterly report publication period and I trade their shares then. However, they may not be interesting for my for the following several months. I use them for their temporal variability and volume change.
Hot stocks – choice
While preparing for a session, I may even create a list of 20 companies. However, it is not possible to trade the shares of them all at once. The best choice possible is to limit the list to only few companies that show, in your opinion, the highest potential for trading. Sometimes you may choose poorly, but at the end of the day you will make better decisions than if you decided to trade all the companies added to the list.
Hot stock filters – pre-session period and social media
I use some filters relating to social media within the framework of Trade Ideas. Thanks to them, I know which most commented companies show the biggest potential for trading.
Below, there is a Cloud link thanks to which you can download the said filter: http://www.trade-ideas.com/Cloud.html?code=11f211b8b0e21430ff8aa80d06a7084f
Cloud link to a pre-session screener: http://www.trade-ideas.com/Cloud.html?code=f276ff1fb4beb2c25492c60ff687c69c
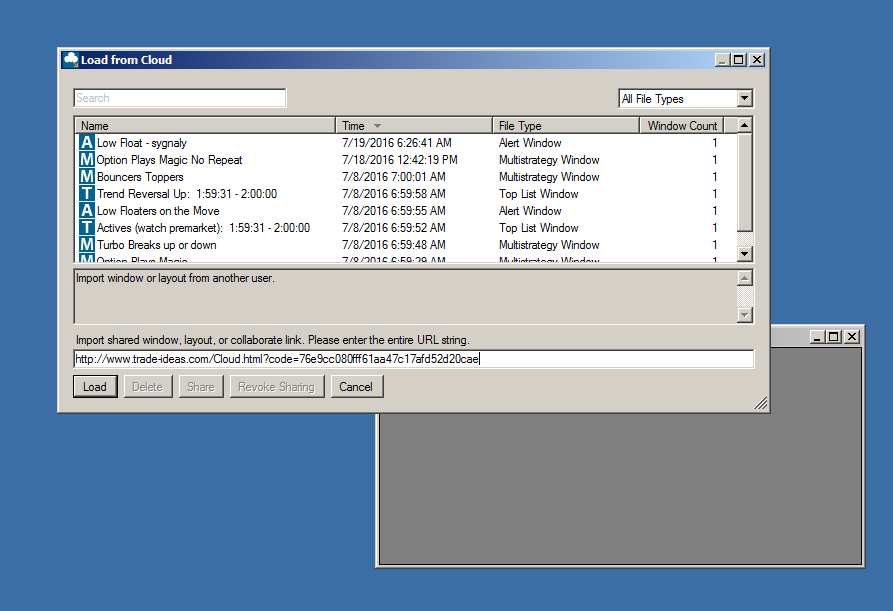
How to add the filters? At first, you have to buy Trade Ideas (use the Trade Ideas promo code 15BEDAYTRADERPL to get it 15 % off!).
Then, follow the instructions shown on the images below:

Do you have your own way of looking for hot stocks? If you have, do not hesitate and share it with me in the comment section below.


